Imagine going out to a restaurant with a group of friends, and the table decides to order a large, expensive charcuterie board to share as an appetizer. The menu says it feeds ten people and costs $40.
If only two of you sit down at the table, that appetizer is going to cost you $20 each. But if eight friends join the table and share the exact same appetizer, the bill drops to just $4 per person.
This is similar to how infrastructure in a City works. Before a street is ever paved, water and sewer lines are buried beneath it to serve the properties on both sides. The expensive part is installing and maintaining the utility corridor itself. To accommodate growth, many neighborhoods were engineered for significantly greater intensity than their current population levels. Inviting more friends to join should result in a significantly smaller bill for everyone.
The Zero-Sum Friction of Growth
Building new housing causes immediate, concentrated inconvenience to existing residents. Construction brings the noises of hammers and heavy trucks. Once new neighbors move in, they start using the on-street parking that existing residents previously had to themselves.
Because of this dynamic, neighbors frequently show up at planning commission meetings to oppose new projects. We call them NIMBYs (“Not In My Backyard”). They often hide behind vague terms like “neighborhood character” to mask a simpler truth: under our current system, development forces them to shoulder 100% of the local costs while receiving 0% of the direct benefits. Even well-intentioned residents naturally resist change when the burdens feel immediate and the benefits abstract.
Meanwhile, cities desperately need this development to maintain their tax base. Consider Grand Rapids, Michigan, where I am currently trying to develop a six-unit project on a vacant lot along the 800 block of Prospect Avenue NE.
Adding an Accessory Dwelling Unit (ADU), a duplex, or a small apartment building to a block is simply inviting more friends to the table to share the appetizer that was ordered decades ago. The infrastructure is already sitting under the asphalt; adding households simply splits the bill into smaller pieces. The city wins, and the new residents win. But the existing neighbors feel like they lose.
The Core Problem: Growth without reinvestment breeds resentment. Growth with shared benefits builds support. To fix the political gridlock surrounding housing, we have to turn development into a positive-sum game.
The Hidden Math of a City Block
To understand how we fix this, we have to look at how a city actually makes and spends money.
Grand Rapids relies on a mix of property taxes and a localized 1.5% income tax (for those who both live and work in the city). While property tax bills look large, the city government only keeps about 25% of that revenue; the rest is taken by the county and state. In practice, income taxes bring in nearly 2.5 times what property taxes do for GR’s general fund.
When you blend the median household income ($70,000) with the median home value ($300,000), a single new housing unit generates approximately $2,663 per year in direct revenue for the City of Grand Rapids.
Now let’s look at the expense side. According to infrastructure cost data compiled by Flywheel from local City Engineers and County Road Commissions, the average cost to replace utility lines and roads in West Michigan breaks down like this:
| Infrastructure Type | Cost per Linear Foot |
|---|---|
| Water Line | $450 |
| Sewer Line | $500 |
| Public Road | $350 |
| Total | $1,300 |
Case Study: The 800 Block of Prospect Ave NE
Let’s look at how this plays out in the real world on a block I’ve become deeply familiar with while designing my 6-unit infill project in Belknap Lookout.
The length of Prospect on this single block is 650 feet. At $1,300 per linear foot, the total replacement cost for the water, sewer, and road infrastructure is $845,000. Assuming a standard 30-year engineering lifespan, maintaining this single block costs roughly $28,167 per year.
The original plat map created 26 parcels, each with 50 feet of frontage. Splitting that fixed baseline infrastructure bill across those original parcels means each lot’s inherent share of the street’s upkeep is $1,083 per year.
Original Plat Map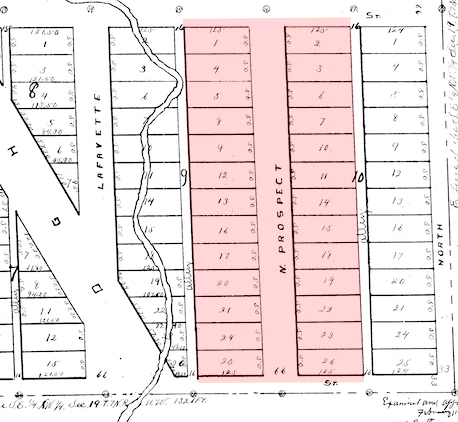
But over time, actual development deviated from the neat lines of the surveyor’s grid:
GIS Map - Actual Development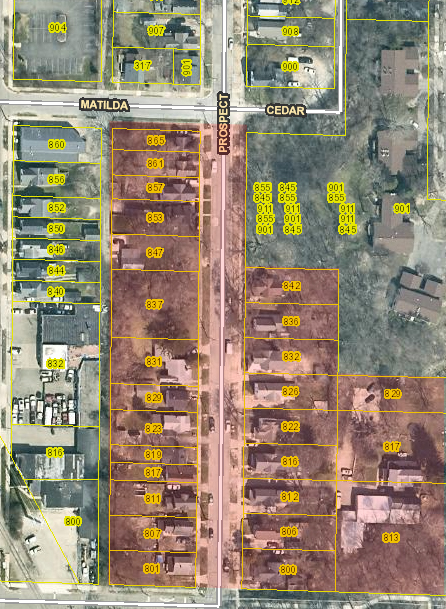
Four lots on the northeast side (Lots 2, 3, 6, and 7) were combined with lots on North Avenue to construct condominiums. A steep slope running through that side of the block has never been built on, meaning no housing units are facing Prospect there to pay for its pipes.
Conversely, that same steep slope means six lots on the southeast side of the block to the east require a shared driveway off of Prospect for access. Meanwhile, on the southwest side, Lot 20 was split in half to build two separate homes.
Coincidentally, due to these balancing shifts, there are still exactly 26 parcels on this block, even though their frontages are completely different. But an important caveat: vacant, undeveloped lots have never paid for the original infrastructure and aren’t contributing annual taxes to pay for its future replacement.
To maintain 650 feet of this package of infrastructure, here are the annual costs per unit:
- 26 Baseline Units = $1,083 per unit
- 39 Units (+50% Density) = $722 per unit
- 52 Units (+100% Density)= $541 per unit
If we double the number of units on a street, the infrastructure cost per household shrinks by half. Unfortunately, because municipal finance averages these costs across the entire city budget, the households living on dense, highly efficient blocks never see these savings on their tax bills. They are subsidizing the sprawling, less efficient edges of the city.
The Proposal: The Block Dividend
We should reward the blocks that actively welcome density and split the city’s infrastructure bill. I propose a direct, localized incentive system: The Block Dividend.
If a block increases its housing unit count through infill development, a portion of the newly generated tax revenue should be paid back directly to everyone living on that block as a property tax credit.
The Shared-Growth Model
| Stakeholder | Current Perception | Shared-Growth Model |
|---|---|---|
| City | ✅ ✅ Big Win | ✅ Win |
| New Neighbors | ✅ Win | ✅ Win |
| Current Residents | ❌ Lose | ✅ Win |
| Overall Dynamic | Zero-sum growth | Positive-sum growth |
| Public Sentiment | “Growth benefits everyone except us.” | “Growth improves life for existing residents too.” |
| Political Result | Backlash and resistance | Broad support and buy-in |
Based on conservative revenue modeling for Grand Rapids, the city could implement a tiered property tax relief program that keeps the city’s baseline net revenue completely protected while passing the surplus down to the street level:
| Density Increase | Total Units | GR Revenue | Infrastructure | Net Revenue | Incremental vs. Baseline | Per-Unit Dividend |
|---|---|---|---|---|---|---|
| Baseline | 26 | $69,225 | $28,167 | $41,058 | — | $0 |
| +50% | 39 | $103,838 | $28,167 | $75,671 | $34,613 | $887 |
| +100% | 52 | $138,450 | $28,167 | $110,283 | $69,225 | $1,331 |
Note: this is an illustrative model using simplified assumptions for directional, general analysis rather than actuarial forecasting. I recommend a flat dollar amount instead of a percentage to keep things simple.
The following assumptions drive the model. These are conservative estimates — actual new residents skew higher income than the median.1
| Variable | Value | Notes |
|---|---|---|
| Median Household Income | $70,000 | Rounded 2024 Census estimate for Grand Rapids2 |
| Median New Housing Unit Value | $300,000 | |
| Blended Millage Rate | 43 mills | Weighted avg of PRE (34) and non-PRE (52) rates |
| Annual Property Tax | $6,450 | $300k × 50% taxable value × 0.043 |
| City Income Tax Rate | 1.5% | Resident + worker in GR; 0.75% each |
| City Share of Property Tax | 25% | Remainder goes to county and state |
Using those inputs, each new housing unit generates approximately $2,663/year in City revenue: $1,050 from income tax and $1,613 from the City’s share of property tax.
Infrastructure costs for the 800 block of Prospect Ave NE run $28,167/year (650 linear feet × $1,300/ft ÷ 30-year lifespan). With 26 existing units, that’s $1,083/unit/year — a fixed cost that shrinks as more households share it.
For the median homeowner paying $6,450 in property taxes, hitting a 50% density target translates to a $887 annual Block Dividend, a 14% permanent reduction in their tax bill. Hitting a 100% density target yields a $1,331 annual Block Dividend, a 21% reduction.
To prevent this from becoming a hyper-local version of California’s Prop 13 or exacerbate Michigan’s problematic Headlee Amendment, the dividend should be fixed-duration rather than permanent — perhaps 10 or 15 years from the date the density threshold is reached. At expiration, the full tax revenue returns to the city’s general fund, and the neighborhood can pursue a new cycle if additional density is added. This avoids creating a financial lock-in that discourages homeowners from selling, which would tighten supply and undermine the very goal of the program.
The dividend is distributed equally to all units on the block — including new residents. This keeps the incentive intact as density grows incrementally: every new neighbor joins the coalition rather than arriving as an outsider.
Reversing the Political Polarity
In economics, bad policies persist because of concentrated benefits and diffuse costs. If a special interest group wins a multi-million dollar subsidy, the benefit to them is massive and concentrated. Meanwhile, the cost is spread so thinly across millions of taxpayers that no individual has a strong financial incentive to show up and fight it.
NIMBYism is the exact opposite: the costs of development are highly concentrated on one block, while the benefits are diffused across a city budget of thousands of people.
The Block Dividend reverses this polarity. It concentrates the financial benefits of growth directly on the block experiencing the disruption. The goal is to return enough visible value to align neighborhood incentives with citywide fiscal health. It creates a win, win, win scenario!
Can you imagine a public zoning meeting where neighbors aren’t fighting a developer, but instead begging them to add two more ADUs or a duplex to a proposal just so the block can unlock its next tax reduction tier?
Anticipating the Skeptics
Whenever a new plan is proposed, critics will point out the structural hurdles. This is a good process, as they may raise issues I didn’t consider. Let’s address those that I have thought through:
- “Can our city grid handle this influx?”
Yes. Grand Rapids has massive excess infrastructure capacity. The Lake Michigan Filtration Plant operates at just 26% average utilization, and the city’s Water Resource Recovery Facility runs at 66%. The system can easily absorb more than 150,000 additional residents before capacity limits require structural upgrades.
- “Is this legal under Michigan law?”
Currently, no. Michigan municipalities have strict caps on property tax adjustments, and cities only retain a fraction of total millage collections. Implementing direct tax credits would require state-level enabling legislation.
However, a city could easily run a variant of the Block Dividend without changing a single tax law. The city could allocate something like 20%-50% of newly generated revenue from dense blocks into a dedicated, hyper-local “Block Dividend Trust Fund”. This money could then be spent entirely on visible, hyper-local, quality-of-life upgrades chosen by the residents of that exact block; things like:
- street trees
- sidewalk enhancements
- traffic calming
- alleyway paving
While I believe it would be much less effective than establishing a direct financial incentive, it may help change the minds of some neighbors. ¯_(ツ)_/¯
Where This Model Needs Verification & Tweaking
An idea this radical shouldn’t be deployed blindly. To make this policy functional, city administration would need to test its limits and refine its assumptions against a few clear shortcomings:
- The Non-Zero Marginal Cost of People: While infrastructure like pipes and streets are largely fixed assets, people require operational city services. New households mean more emergency calls, more trash trucks, and more parks maintenance. This model assumes the city can afford to give back 100% of the incremental infrastructure savings, but in reality, a portion of that tax revenue must be held back by the city to cover the marginal cost of public safety and general government operations.
- Sample Size and Neighborhood Variation: The numbers modeled here are built out from a single 650-foot block in Belknap Lookout. Frontage lengths, property values, and demographic income tiers vary wildly between Easttown, the West Side, and Southeast Grand Rapids. To make this work equitably, the math needs to be verified across a broader, data-backed citywide topology.
- The “Cliff” Boundary Problem: Requiring a block to hit an exact +50% density threshold creates an all-or-nothing system. If a block adds 12 units instead of the required 13, the existing neighbors get 100% of the construction headache and 0% of the tax relief. The policy could be tweaked to offer a continuous per-unit dividend, where every single housing unit added provides an immediate, incremental tax credit on the next cycle. However, I lean towards a discrete goal because it makes a neghborhood organize around a collective goal instead of just passively benefiting from new construction that would have happened anyway.
- While the Block Dividend is structurally envisioned as a property tax credit to align with municipal collection systems, its core behavioral goal is to give the people living on the block a financial stake in its growth. In neighborhoods with high concentrations of renters, a standard tax credit creates a perverse incentive: landlords receive a financial windfall while the tenants (who actually endure the construction noise and parking disruptions) receive nothing. To prevent this equity gap, the program could adapt mechanisms from traditional PILOT (Payment in Lieu of Taxes) programs or affordable housing covenants. For instance, to unlock the Block Dividend on a non-owner-occupied property, the city could require the landlord to sign a binding pass-through or sharing agreement. This covenant would mandate that a verified percentage of the property tax credit be directly credited toward the tenants’ monthly rent. If the landlord refuses to sign, their portion of the dividend is forfeited.
- Too often, it seems like legislators pass laws that seem like good ideas, but become administrative nightmares. While blocks may seem obvious, no data set defines a “block” in city databases, as far as I know. They think in terms of parcels, zones, and precincts. If a massive 50-unit development is built on a corner lot, does the dividend go to the street it faces? What if the developer wants to change the orientation to the other cross street? What if it’s half commercial and half residential? I think “the block” would legally be defined by properties fronting the same utility corridor, so the question would be from which pipe do they get their water?
Conclusion
Remember the charcuterie board? Right now, when new neighbors pull up a chair to the table, the city keeps charging everyone full price for the appetizer while pocketing the surplus. It is a raw deal for existing homeowners, and we shouldn’t blame them for fighting back.
The Block Dividend changes the math of urban growth. It transforms development from something that happens to a neighborhood into an asset that a neighborhood can collectively earn. If you want to change what happens at a chaotic planning commission meeting, stop arguing over aesthetics; change the financial incentives of the people sitting in the room instead.
Grand Rapids Water & Wastewater Capacity vs. Usage Stats
| Metric | Fresh Water (Lake Michigan Filtration Plant) | Wastewater (Water Resource Recovery Facility) |
|---|---|---|
| Treatment capacity | 135 MGD | 61 MGD |
| Avg. daily flow | ~35–36 MGD | ~40 MGD |
| Max daily demand / peak flow | ~73 MGD (rated); 90 MGD (2003 record) | 90 MGD (peak rated) |
| Avg. utilization | ~26–27% | ~66% |
| Population served | ~280,000 (137 sq mi service area) | ~300,000+ (city + 11 communities) |
| Source / discharge | Lake Michigan (West Olive intake) | Grand River |
Our public utilities are more than ready for this infill. 300,000/66% = 454,545 people, so after adding about 154,545 people to the system, we’d be at max capacity. The current GR population is about 200k, so it’ll be quite a while before we have to begin worrying about that.
Sources:
- Wastewater capacity/usage: U.S. DOE Better Buildings Initiative — City of Grand Rapids WRRF
- City Environmental Services (city-published avg flow confirmation)
- Tour the Lake Michigan Filtration Plant
This is conservative. The largest share of people moving to the city are high-income households earning more than 120% of AMI. But I like to be conservative in my math. https://www.urbangr.org/taxonomy/term/8 ↩︎
The original number was $69,108, but it was in 2024 dollars, so I rounded it to $70k for easy math. https://www.census.gov/quickfacts/fact/table/grandrapidscitymichigan/PST045224 ↩︎