Do you consider yourself to be risk-averse, risk-neutral, or risk-seeking? Mind writing it down? I’m serious. Do it before reading further!
Okay, here’s the bet: you provide a fair coin and toss it. Heads you win $x. Tails you lose $100. How much does ‘x’ have to be for you to take the bet?
How does “x” change if we increase the size of that bet to $1000, or $10k? If you want to play along, I’d suggest writing down your answers. How would the numbers you chose change if we repeated each of the above experiments 100 times?
Do you consider yourself to be risk-averse, risk-neutral, or risk-seeking? Did your answer change from above?
I’m fascinated by cognitive biases. These are systematic errors in thinking that most people share. My fascination comes because these errors are still made even when we know about the bias! One of the most common is loss aversion which states that the pain of losing is greater than the pleasure of gaining an equivalent amount. A few years ago, I read the book Decisive by the Heath brothers. They share an idea of a coin-flip bet where one wins $100 on heads and loses $50 on tails. In experiments, many people turn down this bet due to loss aversion. Most corporations would love to bet on projects with those odds. And you should too. 2:1 odds aren’t very common. But knowing that isn’t likely to change your mind.
The Heath brothers share that most people act as though losses are two to four times more painful than gains are pleasurable. Another book called Nudge by Richard Thaler presents the experiment I posted above as a way to measure loss aversion. Thaler writes that most people will demand at least twice as much as they risk which is right at the lower limit of what the Heath brothers suggest. So, I decided to run an informal experiment on Facebook with my friends. I whipped up a Google Form to ask the same questions I asked above. And then I wrote down my hypotheses:
- Most will self-identify as risk-neutral in the beginning.
- Most will exhibit risk-averse behaviors demanding 2:1 odds.
- As the dollar size increased, the ratio of win:lose would increase.
- When repeated 100 times, the required odds will decrease because one bet with a $200 win vs. a $100 loss is much riskier than 100 of those same bets. Due to the law of large numbers, even a slight increase in odds is highly likely to yield a positive payoff.
- At the end of the experiment, those who first identified as risk-neutral or risk-seeking would realize that they were, in fact, risk-averse.
Results
- 20 people completed the experimental survey
- 4 people identified as risk-averse and retained that classification at the end
- 2 of the 11 participants who identified as being risk-neutral changed their self-assessment to risk-averse at the end
- None of those identifying as being risk-seeking changed to being risk-averse even though 60% of them exhibited risk-aversion in their bets.
- The average age was 42; the median was 34.5.
- 13 were male; 7 were female.
Classification Summary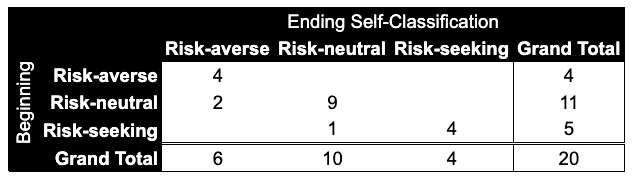
Scenario 1 (1x experiment):
Questions: Let’s make a bet on a fair coin toss: Heads you win $X, tails you lose $Y. How much does X have to be for you to take the bet?
I substituted Y for 3 orders of magnitude: $100, $1000, and $10,000. I show the breakdown by self-classified groups as a multiple of what was risked. I’m calling this the risk ratio. A risk ratio of 1 is a risk-neutral bet. So the 1.3 for the risk-seeking folks at the $100 level represents that on average they wanted X to be $130. For the risk-averse folks, they wanted X to be $1080.
Scenario 2 (100x experiments):
I tweaked the experiment so that we were now repeating the coin toss $100 times. This scared some participants into not being willing to take the bet at all due to the total capital risked.
Averages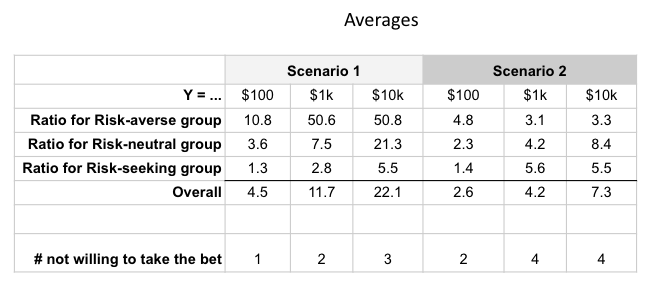
Medians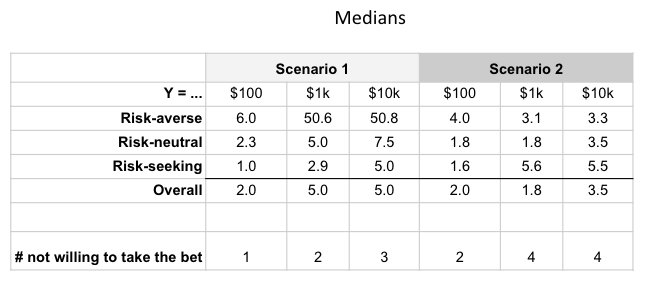
Scenario 1 at $100 risked
Scenario 1 at 100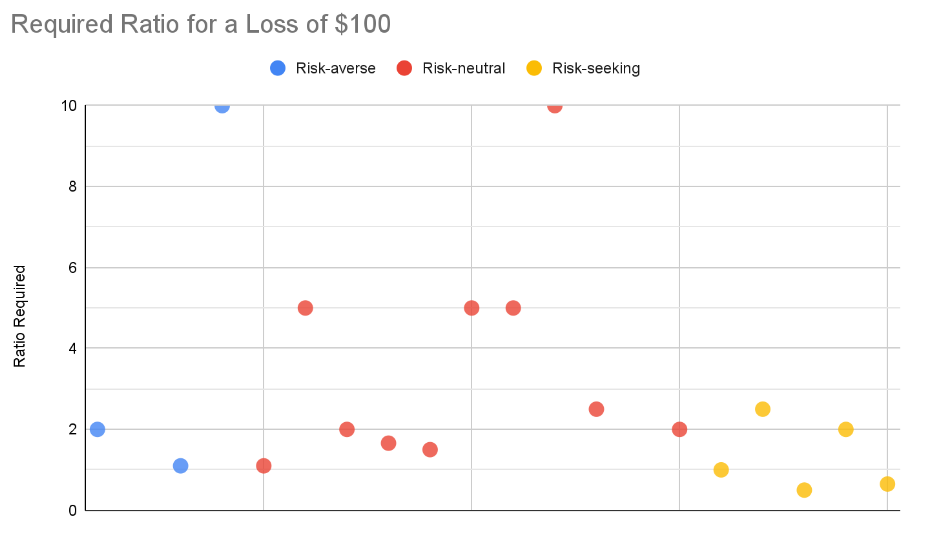
Self-identified risk-seekers:
- only two exhibited risk-seeking behaviors. (Ratios below 1).
- one exhibited risk-neutral behaviors (ratio equal to 1)
- two exhibited risk-averse behaviors; in the end, they still believed themselves to be risk-seeking!
Self-identified as risk-neutral:
- ALL exhibited risk-averse behavior
Self-identified as risk-averse:
- ALL behaved as expected
Scenario 1 at $1000 risked
Scenario 1 at 1000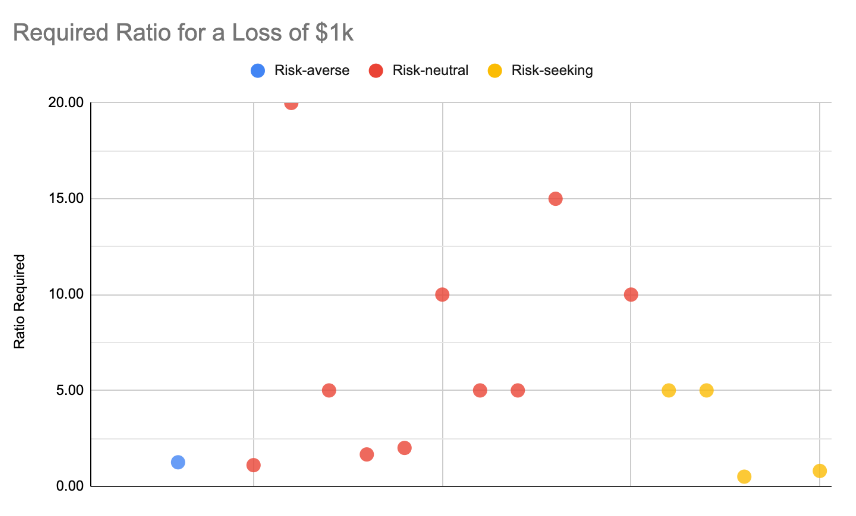
Self-identified risk-seekers:
- same two kept their risk-seeking behaviors
- one chose not to bet
- two exhibited increased risk-averse behaviors (5x when before it had been 1 and 2.5x, respectively)
Self-identified as risk-neutral:
- ALL exhibited risk-averse behavior
Self-identified as risk-averse:
- Only one person of the original 4 was willing to bet and did so with a risk-averse ratio. The other 3 exhibited extreme risk aversion.
Scenario 1 at $10,000 risked
Scenario 1 at 10000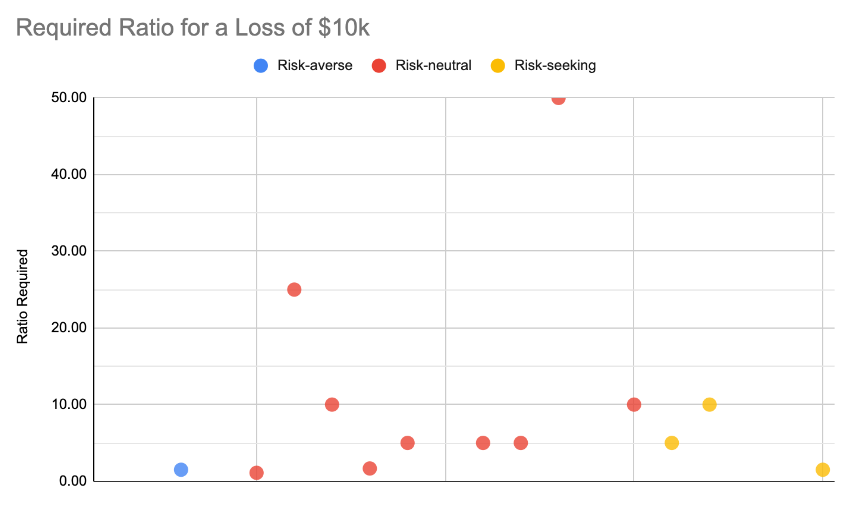
Self-identified risk-seekers:
- another person drops out
Self-identified as risk-neutral:
- ALL exhibited risk-averse behavior
Self-identified as risk-averse:
- Only one person of the original 4 was willing to bet and did so in a risk-averse ratio
Then I wanted to see how things in Scenario 2 compared
I compared each person’s ratios under Scenario 2 with their Scenario 1 ratio for each dollar amount. Hypothesis 4 was that this would go down, but they were about even:
| S2 < S1 | $100 | $1k | $10k |
|---|---|---|---|
| True | 10 | 8 | 7 |
| False | 8 | 6 | 7 |
| No bet on 1 | 2 | 6 | 6 |
How did my hypotheses perform?
- Most will self-identify as risk-neutral in the beginning. True. 11 of 20 participants identified as being risk-neutral.
- Most will exhibit risk-averse behaviors demanding 2:1 odds. True. 18 of 20 participants exhibited risk-averse behaviors.
- As the dollar size increased, the ratio of win:lose would increase. True.
- When repeated 100 times, the required odds will decrease because one bet with a $200 win vs. a $100 loss is much riskier than 100 of those same bets. Due to the law of large numbers, even a slight increase in odds is highly likely to yield a positive payoff. False.
- At the end of the experiment, those who first identified as risk-neutral or risk-seeking would realize that they were, in fact, risk-averse. False.
Here’s what I would change if I was running this again:
- I’d change the second scenario so the total dollars at risk were equal to the first. I’d divide the original amounts by 100, so the scenarios would be $1, 100 times ($100 total); $10, 100 times ($1000 total); and $100, 100 times ($10,000 total). The large amounts seemed to scare people away because they assumed they could lose a lot of money versus realizing that because it’s a fair coin, even a small advantage would result in large gains. I suspect this was them not understanding the math vs. making a choice, so I’d do a better job explaining the math too.
- It would also be interesting to reframe the problem as losses instead of gains. Prospect theory suggests most people would flip from being risk-averse to being risk-seeking if framed as losses.